Guess The Plot #3
Can you identify the data represented on the plot?

Answer
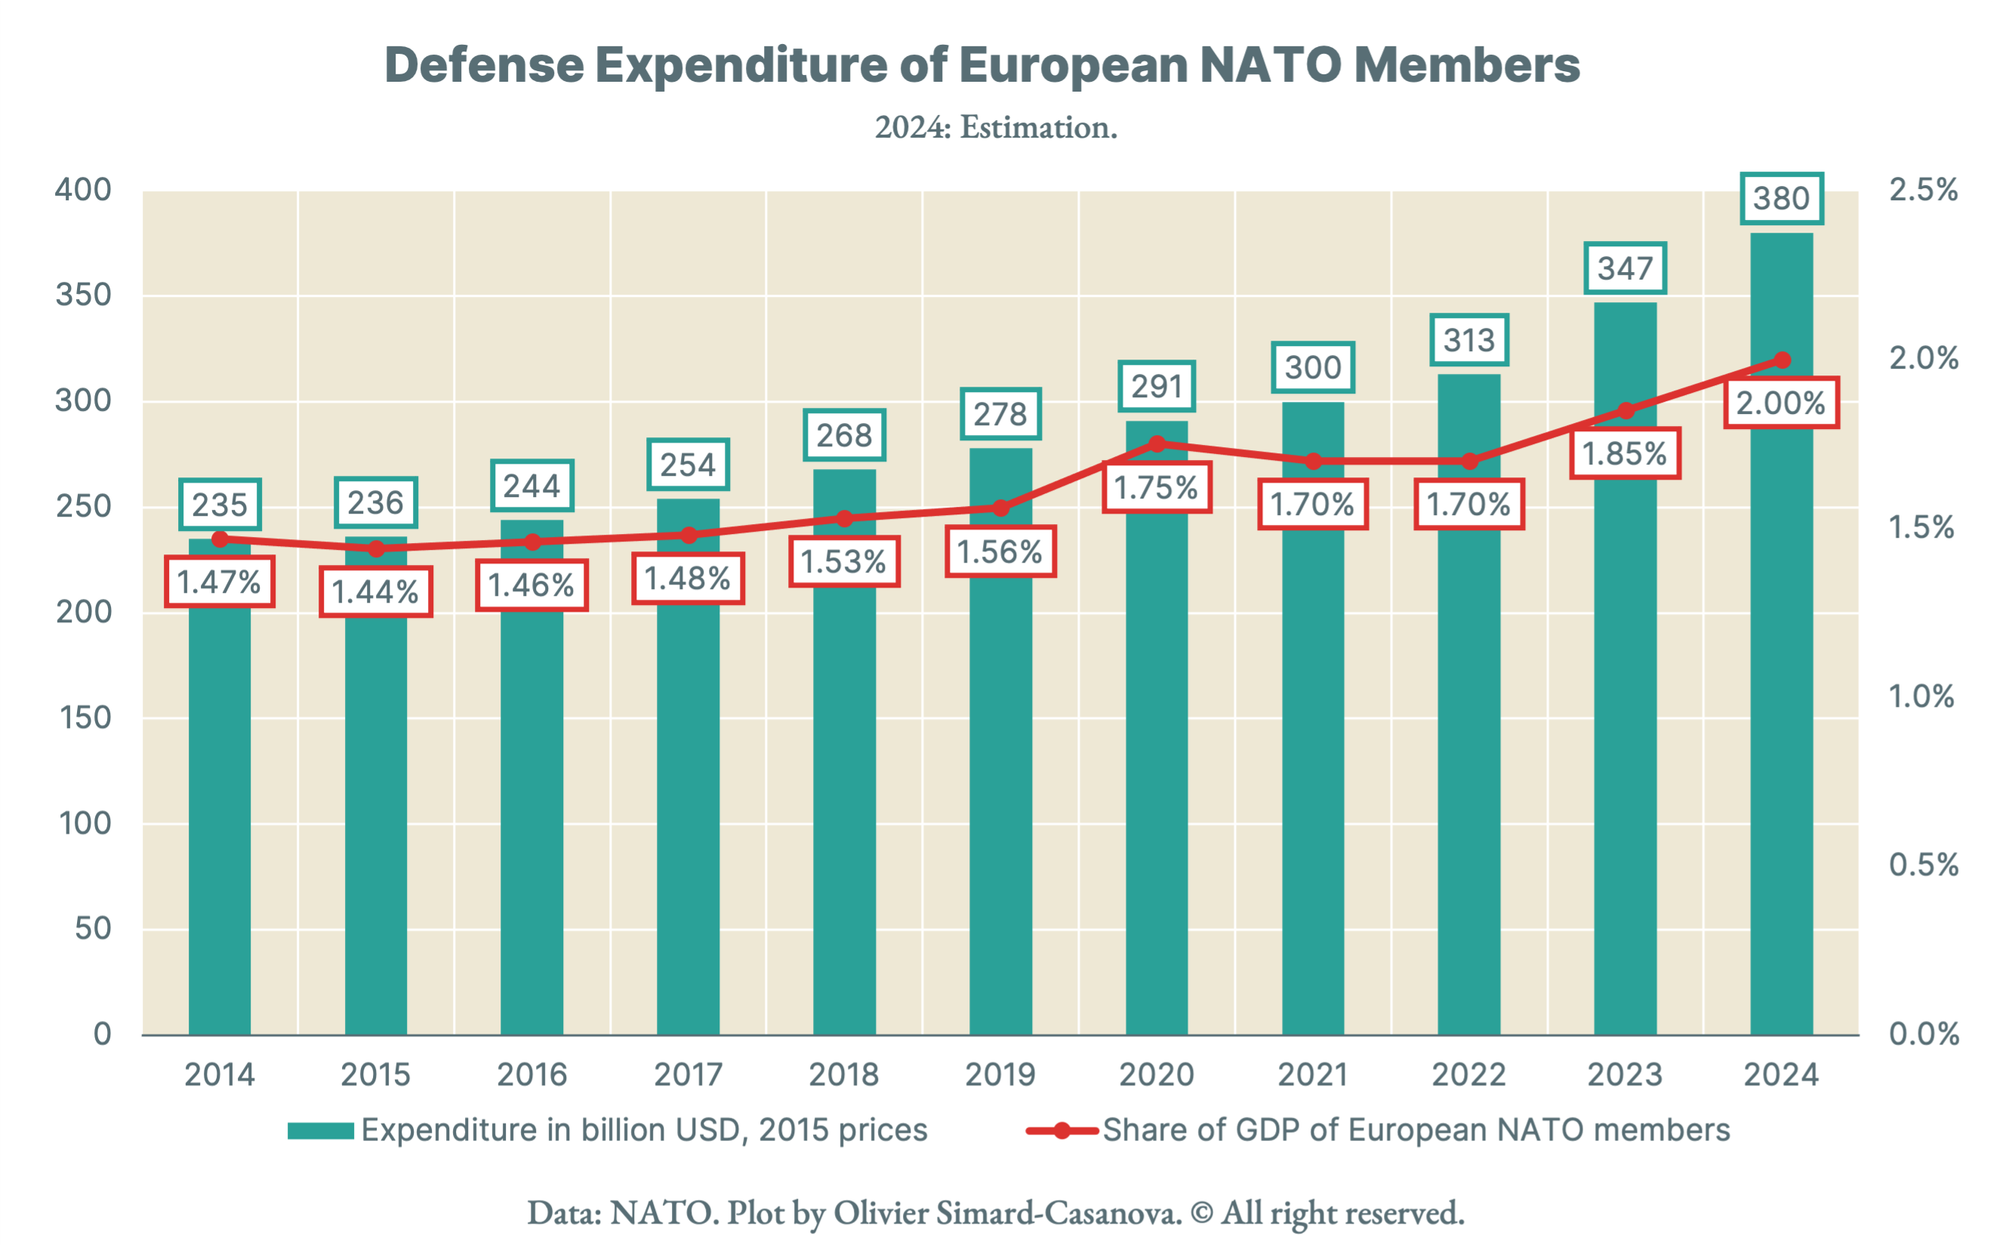
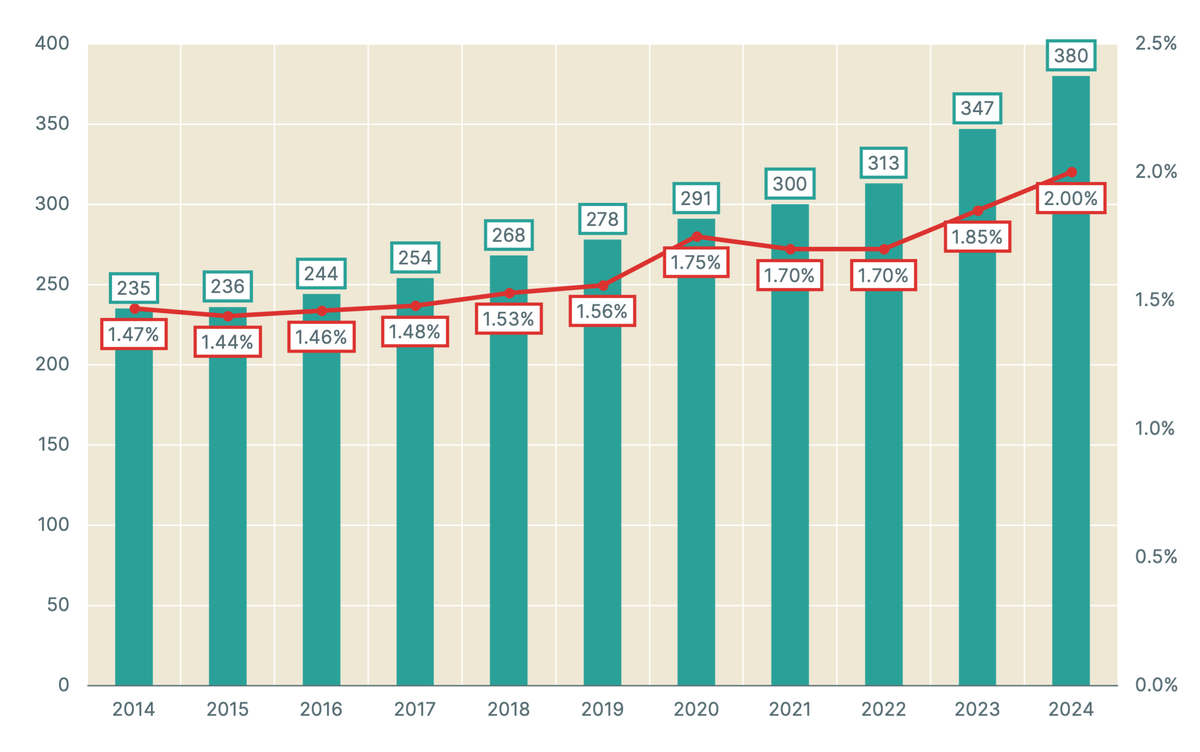
The plot represents defense expenditure of European NATO members, in absolute value (adjusted for inflation, bars) and as a share of GDP (curve).